Most Linux users are obsessed about what’s going on in the background when system devices are running. They want to monitor their computer components as well as seeing how do their computer handle different processes to see if the system is working efficiently.
In this guide, we will introduce a list of free applications and command line tools that will help you keep a close eye on different system components such as monitoring usage and activity of your CPU, installed system memory (RAM), network, hard drives (including partitions), different hardware temperatures, swap, and so on.
1. VMSTAT
Displays information about CPU, memory, processes, etc. Here are some command examples:
vmstat 3
vmstat -a
For more help:
vmstat –help
2. IOSTAT
This command line tool will display statistics about your CPU, I/O information for your hard disk partitions, Network File System (NFS), etc. To install iostat, run this command:
sudo apt-get install sysstat
To start the report, run this command:
iostat
To check only CPU statistics, use this command:
iostat -c
For hard disk:
iostat -d
For more parameters, use this command:
iostat –help
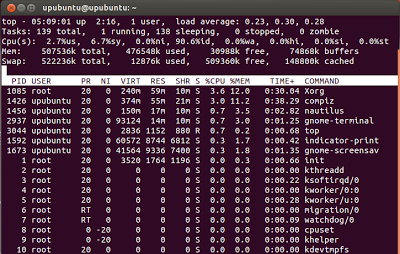
3. TOP

TOP is a command line tool that displays on the terminal active system processes in real-time. It also displays system device usage such as CPU, hard disk, swap, memory, etc. You can start it with this command:
top
To stop it, press CTRL+C. For more parameters, you can run this command:
top –help
4. HTOP

HTOP is another system monitoring tool, but more advanced than the TOP command. HTOP is faster than TOP, and has a clean and organized interface that supports mouse operations. You can install HTOP as follows:
sudo apt-get install htop
5. MPSTAT
The mpstat command line utility will display average CPU usage per processor. To run it, use simply this command:
mpstat
For CPU usage per processor, use this command:
mpstat -P ALL
6. IPTRAF
IPTRAF is a command line utility that displays network statistics in real-time. Install it first with this command:
sudo apt-get install iptraf
To start monitoring network activities with IPTRAF, run simply this command:
sudo iptraf
In the screen that shows up, select which service to monitor and press Enter:

7. /PROC
To get information about system devices with the help of the /Proc file system, you can use these various commands:
cat /proc/cpuinfo
cat /proc/mounts
cat /proc/meminfo
cat /proc/zoneinfo
8. Glances
Glances is a system monitoring tool that displays in real-time CPU/memory/swap usage, load time, network activity, etc.

To install Glances, run the following commands:
sudo add-apt-repository ppa:arnaud-hartmann/glances-stable
sudo apt-get update
sudo apt-get install glances
To start system monitoring, issue this command:
glances.py
9. Saidar
Saidar also allows to monitor system device activities via the command line.

You can install is with this command:
sudo apt-get install saidar
To start monitoring, run this command:
saidar -c -d 1
Stats will be refreshed every second.
If you have another useful system monitoring tool, you can mention it below.